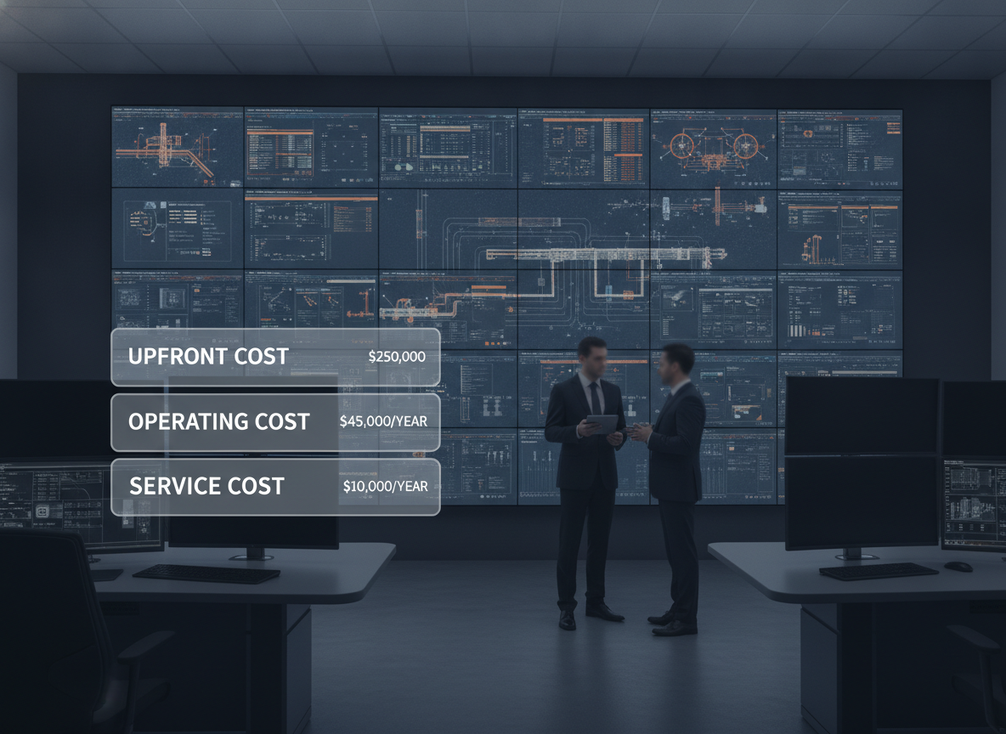
Fine pitch LED TCO starts with one simple correction: the quote is not the full price. For 24/7 command rooms, the real decision is how capital cost, power, cooling, service, and replacement risk add up over time in any fine pitch LED TCO model. If you model only the invoice, you are likely to miss the costs that shape budget approval later.
What Purchase Price Leaves Out
The purchase quote is only the first line in the budget. Installation, rigging, commissioning, power distribution, service access, and future repairs can become material over a 5-year or 10-year horizon, especially in continuously running rooms.
A useful fine pitch LED TCO model separates one-time capital expense from recurring operating expense. That sounds obvious, but it changes the procurement conversation: if a wall runs every day, the buyer should care less about a low sticker price and more about what the display costs to keep visible, cool, and supportable.
A practical rule of thumb is this: if the room is mission critical, do not treat maintenance as an afterthought. The 24/7 video wall options path is a useful starting point only if you are already comparing 24/7 deployment requirements, not because a product page can replace your own cost model.
For buyers building a public-sector justification, the DOE lifecycle view is a good reminder that use-phase energy can outweigh purchase price over time. The exact ratio depends on runtime, local rates, and service assumptions, but the direction is the important part: the quote is rarely the whole story. DOE lifecycle guidance on LED use-phase cost supports that conservative framing.
Model Energy, Cooling, and Runtime
For most buyers, average power draw matters more than peak brightness. Peak ratings are useful for comparing capability, but they do not tell you what the wall will cost to operate all day. ENERGY STAR’s signage display guidance notes that certified signage displays are, on average, about 4% more efficient than conventional options, which is modest on paper but can matter over long runtimes. ENERGY STAR signage display guidance is the cleanest public reference for that point.
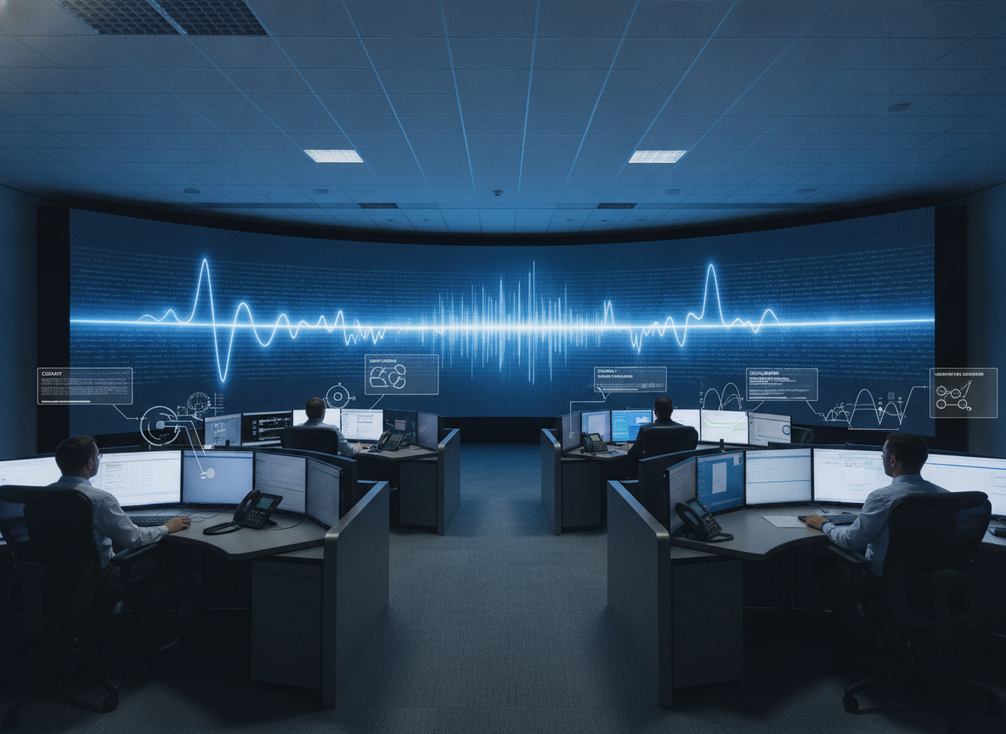
What this means in practice is simple: if a room runs longer, the energy line in your model becomes more important, and the cooling line usually grows with it. In a 24/7 control room, display heat is not a side detail. It can add to HVAC load, especially when the room already runs near capacity.
A conservative buyer should test at least three runtime cases before locking the budget: 12 hours, 18 hours, and 24/7. That does not create a forecast by itself, but it reveals whether the project is mostly a capital purchase or a long-run operating commitment.
If you want a deeper technical follow-up on engineering and compliance language, the engineering resilience article is a reasonable companion read. Use it as background, not as proof of your operating cost assumptions.
Average Power Draw Versus Peak Ratings
Average draw is the number that drives annual utility cost. Peak brightness tells you the top of the range, but not the steady-state profile your facility will actually pay for. If you are comparing two fine-pitch LED walls, ask for the expected operating draw under your content type, not only the maximum spec.
This distinction matters most when the wall shows data dashboards, maps, or mostly static command information. Those use cases often do not behave like a full-white showroom demo, so a model based on peak output can be too aggressive for cost planning.
Cooling Load in 24/7 Control Rooms
Cooling belongs in the model because display heat becomes part of the room load. In a facility with limited HVAC headroom, even a modest increase can force either higher energy spend or a room upgrade.
That is why energy-efficient fine-pitch designs matter most when the display runs long hours and the room cannot absorb extra heat easily. If your HVAC system is already near its limit, a lower-power wall can improve the cost case more than a slightly cheaper quote with worse operating draw.
Runtime Assumptions for Budget Scenarios
Runtime is the lever that changes the whole TCO story. At 12 hours, energy may be a secondary line item. At 24/7, it can become one of the largest recurring costs, and the case for a more efficient design strengthens.
Use your actual operating schedule, not a generic assumption. A project that looks reasonable for a daytime operations center may look very different in a mission-critical room that never goes dark.
Compare Maintenance Paths and SLA Exposure
Maintenance can save money or quietly consume it. The lowest-risk path is not always the cheapest annual service plan; it is the one that matches the room’s downtime tolerance, internal support coverage, and parts strategy.
| Service Path | Response Time | Spare-Parts Inventory | Remote Support Coverage | Downtime Exposure | Likely Cost Impact |
|---|---|---|---|---|---|
| In-House Maintenance | Depends on staffing | Buyer-held | Usually limited to vendor guidance | Can be low if the team is trained | Lower contract cost, higher internal labor burden |
| Standard Vendor Support | Moderate | Usually minimal onsite stock | Included or limited | Moderate, especially after hours | Balanced cost, moderate risk |
| Enhanced SLA | Faster commitment | Often stronger parts access | Broader escalation coverage | Lowest if the contract is well written | Higher annual cost, lower outage risk |
The key decision is not response time alone. AVIXA’s discussion of modern LED service expectations is a useful reminder that response window, parts availability, and escalation path should be evaluated together. A fast answer time with no spare parts can still leave you waiting.
A second friction point is inventory. Keeping spare modules on hand can reduce outage time, but it also creates carrying cost, shelf-life questions, and procurement overhead. For a public buyer, that trade-off should be written into the TCO model instead of hidden in the service appendix.
Where Energy-Efficient Designs Change the Math
Energy-efficient fine-pitch LED TCO improves most when three conditions line up: long operating hours, meaningful HVAC impact, and a service model that avoids expensive downtime. If only one of those applies, the premium may be harder to justify.
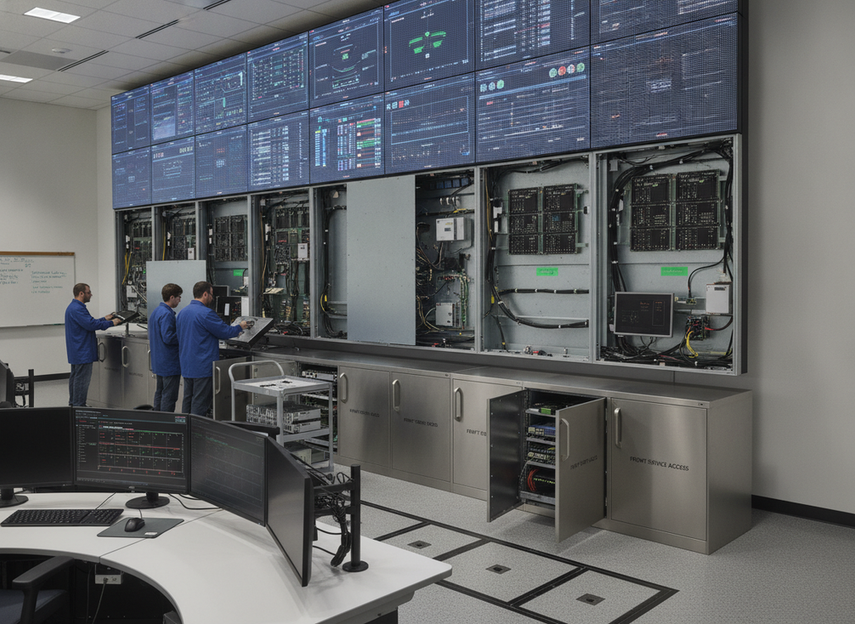
That is why a premium wall is not automatically a better economic choice. If your room runs only part of the day, or if your HVAC has plenty of headroom, the savings from a more efficient design may be too small to move approval. But if the wall runs continuously and service access is tight, front-service designs and lower operating draw can meaningfully reduce lifetime cost.
This is also where browsing paths become useful. The C-Pad collection is the more natural place to start when uptime and serviceability are the main concerns. The C-Max collection makes more sense when you are comparing broader commercial indoor display options and want to screen for fit before narrowing the procurement list.
A good buyer question is: would this design still make sense if the room ran longer than expected? If the answer is yes, the premium is more defensible. If the answer is no, the lower-cost option may be the safer procurement choice.
Run Five-Year and Ten-Year Scenarios
Use a simple step model instead of trying to solve the whole project at once.
- Define the installed scope. Include the wall size, control equipment, installation, and any commissioning work.
- Enter annual operating cost. Use average draw, local utility rates, and a realistic runtime assumption.
- Add cooling impact. Treat HVAC as a separate operating line item if the room has limited headroom.
- Include maintenance terms. Use response window, parts access, labor exclusions, and escalation coverage.
- Add refresh or replacement risk. Be conservative, especially if the wall is expected to run for a decade.
- Compare 5-year and 10-year totals. Then divide each by the model term to get a simple annualized view.
A 5-year model is usually better for budget-cycle comparison. A 10-year model is better for seeing how energy, service, and replacement assumptions compound. That is why fine pitch LED TCO should never be judged on first-year savings alone.
Scenario Split to Watch
If the wall runs long hours, the 10-year case often becomes more sensitive to energy and maintenance than the 5-year case. If it runs fewer hours, installed cost and service terms may dominate instead.
That is the flip most buyers miss. The cheapest quote can look fine in a short budget window and still be a weaker option once runtime, cooling, and support are modeled honestly.
Fine-Pitch LED TCO: What Changes as Runtime Increases
Model installed cost and maintenance first at low runtime, then add cooling and energy as runtime increases. The balance can shift toward longer-horizon operating cost when the wall runs heavily.
View chart data
| Category | Installed cost + maintenance | Cooling added | Energy dominates |
|---|---|---|---|
| Low runtime | 1 | 0 | 0 |
| Moderate runtime | 1 | 1 | 0 |
| Heavy runtime | 1 | 1 | 1 |
Buyer Checklist Before You Sign
- Confirm the average power draw used in the quote model, not just the peak brightness spec.
- Confirm the HVAC assumption and ask whether the room can absorb the added heat without an upgrade.
- Confirm the SLA response window, parts availability, and escalation path in writing.
- Confirm whether front access, remote support, and labor exclusions are included.
- Confirm the replacement-cycle assumption used in both the 5-year and 10-year cases.
- Confirm whether shipping, installation, and warranty terms are included on the same comparison basis.
The safest fine pitch LED TCO approval is the one that survives a longer runtime, a tighter HVAC room, and a slower support response. If your model still works after those stress tests, you have a stronger procurement case. If it does not, the quote is probably too optimistic.
Related Resources
Browse these navigation paths for additional context on mission-critical and commercial indoor displays: