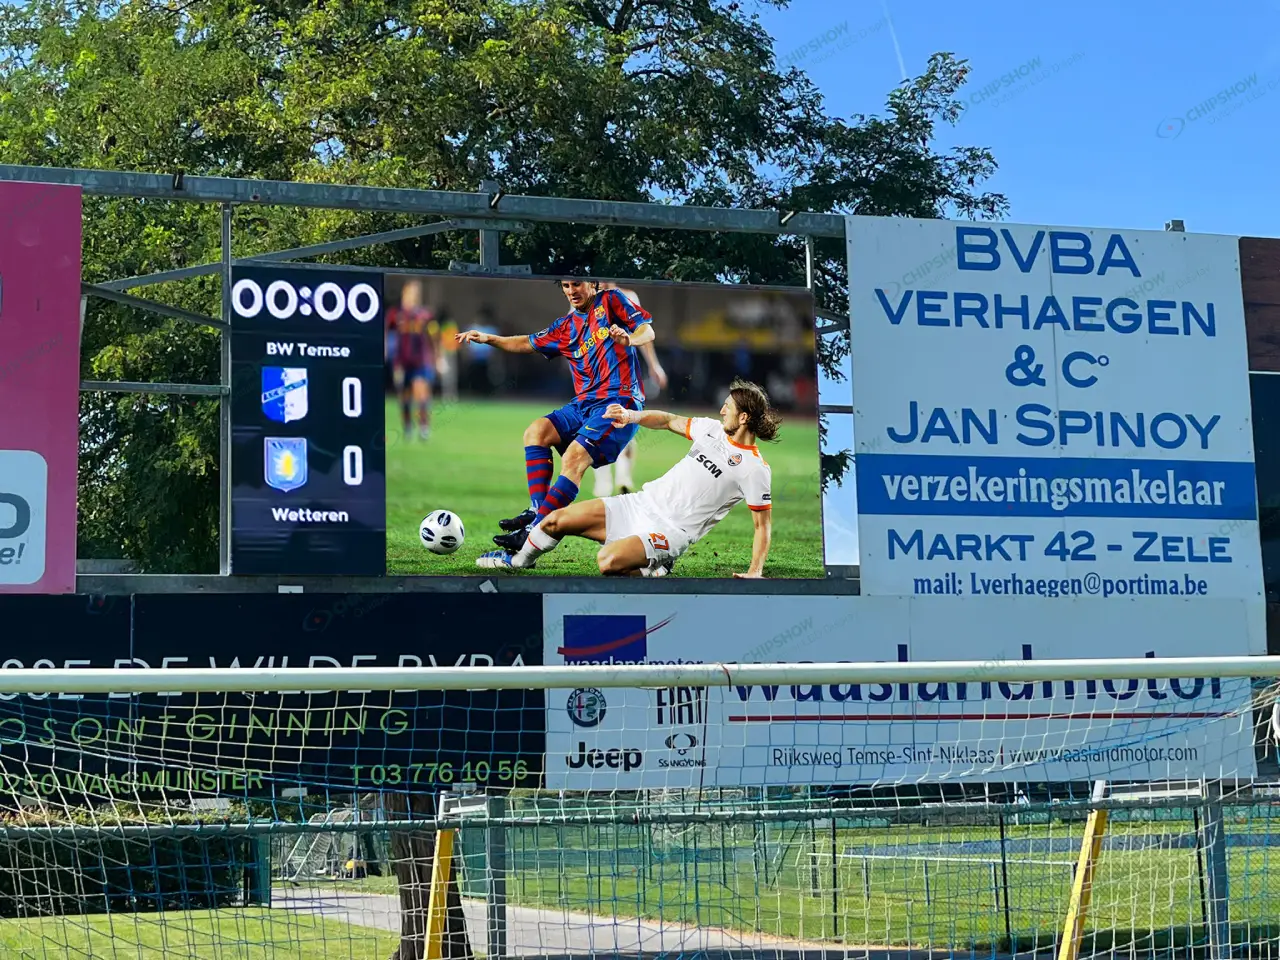
A campaign can deliver a large impression count and still leave the finance team asking what the spend achieved. DOOH return on investment (ROI) connects the cost of the campaign to the value it generated. Start by separating ad delivery, estimated audience exposure and business outcomes, then use the measurement method that fits the decision you need to make.

Why Impression Counts Alone Fall Short
Playback records tell you which ads ran; estimated impressions describe the audience exposure associated with them. Geopath’s OTS and LTS methodology overview discusses the opportunity-to-see and likelihood-to-see distinction. The MRC OOH standard defines a progression from gross to viewable (OTS), LTS and audience measures. Evidence of notice belongs to the more selective LTS criteria; it is not a requirement that every reported gross exposure proves someone looked.
That is the practical difference readers should keep in mind: the same impression count can describe very different exposure conditions. A roadside screen with strong sightlines may support a stronger ROI story than a similar count from a placement with obstruction, awkward angles, or limited dwell time. In other words, DOOH impression measurement is the input, not the verdict.

Keep playback logs and audience estimates on separate lines in the report. One ad play can have several potential viewers, and repeated exposure does not mean additional unique people. Use the DOOH impression measurement guide to check the denominator before connecting exposure to visits, leads or sales.
Core DOOH Measurement Frameworks
The cleanest way to compare DOOH measurement options is to separate the layers they answer. Delivery metrics tell you what was served. Exposure-quality metrics tell you whether the audience had a realistic chance to notice it. Attribution methods try to connect exposure to a downstream outcome such as visits, leads, or sales. The MRC audience measurement standard is the anchor for audience-proof expectations, while the IAB’s campaign-goal matching guidance helps planners choose the right method for the business question.
Delivery Metrics Versus Exposure Quality
Delivery records show when and where ads were played. Audience measurement estimates the exposure associated with those plays, using traffic, visibility and the applicable method. Report reach as estimated unique people and impressions as exposure opportunities; those two measures answer different planning questions.
Attribution Methods That Fit DOOH
DOOH attribution usually works best when the method matches the campaign’s goal. Matched-market logic can be useful when the business question is sales lift, location-based lift may fit traffic or visitation questions, and tagged-response analysis can help with direct site actions. The important boundary is that these methods are typically directional or model-based unless the campaign has unusually strong measurement design.
How to Match Metrics to Campaign Goals
For awareness, delivery and exposure-quality reporting may be enough to support the media decision. For traffic, visits, or sales, you need a stronger link between the screen and the outcome. That is why the right framework is often the simplest credible one that fits the decision, not the one that sounds most advanced.
What Good Reporting Should Include
A usable report should show the date range, market or location scope, audience definition, assumptions, and what was observed versus what was modeled. It should also say what the analysis can and cannot prove. That makes the report easier to audit and harder to overstate, which is exactly what budget reviewers need.
For a new placement, compare the outdoor DOOH options with the audience’s movement, viewing distance and creative format in mind. Match the measurement plan to that setting before using audience estimates in the budget.
| Layer | What to record | What it helps decide |
|---|---|---|
| Ad delivery | Playback timestamps, screen IDs, creative IDs and campaign dates | Whether the booked media ran as planned |
| Audience exposure | Impression definition, traffic inputs, visibility assumptions and estimated reach | Whether the placement offered access to the intended audience |
| Business response | Visits, qualified leads or sales, with the attribution or comparison method | Whether outcomes support the campaign goal |
| Financial return | Campaign cost and estimated incremental contribution before that campaign cost | Whether the measured or modeled benefit justifies the investment |
Viewability and Exposure Quality
Viewability is the bridge between raw presence and meaningful exposure. In Geopath’s measurement process, sightlines and exposure quality are part of the way the environment is translated into a better estimate of notice. That matters because not every delivered impression has the same chance of being seen.
Use this as a practical checklist, not a hard pass/fail rule:

- Check whether the screen has clear sightlines from the main traffic path.
- Check whether vehicles or pedestrians can reasonably view the display long enough for the message to register.
- Check whether trees, poles, adjacent signage, or street furniture obstruct the view.
- Check whether the size, height, and placement fit the audience’s movement pattern.
- Check whether brightness and contrast still hold up in the real environment, especially in direct sun or glare.
The key boundary is that exposure quality is not the same thing as attribution. A screen can be highly viewable and still not produce a measurable business response if the creative, offer, audience, or timing is off. It can also be a weaker fit for some goals even when delivery looks strong on paper.
For placement comparison, a street-level screen option can be a reasonable reference point when the audience is close to the display and moving on foot, while an outdoor display deployment may fit different sightline and distance conditions. The right choice depends on the environment, not just the impression count.
Build a Realistic Payback Model
First decide whose return you are modeling. An advertiser compares campaign cost with the additional contribution generated by the campaign. A media owner buying a screen compares installed and operating costs with net cash earned from selling inventory. Keep those models separate; the outdoor billboard TCO guide covers the equipment-cost side.
Start With the Business Goal
Start by naming the outcome you are trying to influence: awareness, foot traffic, lead generation, or sales. That choice determines which measurements matter most. A brand-awareness buy can often tolerate softer proof than a conversion-oriented campaign, but neither should rely on impressions alone as if they were a finished ROI argument.
Choose the Right Cost Inputs
For an advertiser, include media, creative production and measurement fees in campaign cost. A useful formula is campaign ROI = (incremental contribution before campaign cost − campaign cost) ÷ campaign cost. Calculate contribution after the variable costs of generating the additional sales. Revenue divided by media spend is ROAS, not profit-based ROI.
Model Scenarios Instead of Single-Point Forecasts
Build conservative, base and upside cases using the same cost definitions. As an illustrative calculation, a campaign costing $20,000 with $30,000 in estimated incremental contribution before campaign cost has ROI of 50%: ($30,000 − $20,000) ÷ $20,000. If contribution is only $15,000, ROI is −25%. These are worked assumptions, not campaign results; the comparison shows how much the decision depends on the outcome estimate.
Stress-Test the Assumptions
Change the assumptions most likely to alter the decision: incremental sales, contribution margin, campaign duration and measurement confidence. If the campaign still looks attractive under a tougher case, show that case beside the base forecast. For a screen owner, calculate simple payback from installed investment divided by positive net cash generated per period, using a consistent period and clearly stated occupancy assumptions.
When a team wants a more immersive placement type, a 3D billboard should still be judged by the same rule: the creative may attract attention, but the ROI case still needs transparent assumptions and a match between the screen context and the business goal.
What to Check Before You Present Results
Before you present DOOH ROI measurement results, make sure the report is easy to audit. Show the time window, the audience definition, the location scope, and the data sources used. Label modeled estimates separately from observed outcomes, and state the main limits of the analysis in plain language. That keeps the presentation credible even when the attribution story is still directional. If your team is comparing indoor deployment options, the same reporting discipline still applies before anyone approves more spend.
Final Takeaway
The strongest DOOH ROI measurement approach is the one that separates delivery, exposure quality, and outcome proof instead of collapsing them into one number. If you need to defend spend, start with the simplest framework that matches the campaign goal, then build a scenario-based payback model with explicit assumptions. Compare measurement methods, verify placement quality, and request a scoped measurement plan before you approve the next buy.
FAQs
How Do Operators Measure DOOH ROI?
Most operators combine delivery metrics, exposure-quality checks, and some form of downstream response or lift analysis. The key is to match the method to the campaign goal and to avoid presenting impressions as if they were direct proof of business return.
What Is the Difference Between DOOH Impressions and Attribution?
Impressions estimate exposure opportunity. Attribution tries to connect that exposure to an action such as a visit, lead, or sale. That distinction matters because a strong impression count can still produce a weak attribution story if the audience, offer, or placement fit is off.
Can Viewability Standards Change ROI Estimates?
Yes, because viewability changes the confidence you should place in the exposure story. A better-sighted placement may justify a stronger ROI case than a harder-to-see one, even when the raw delivery numbers look similar.
Why Do Realistic Payback Models Use Ranges Instead of One Number?
Because DOOH outcomes depend on assumptions that rarely stay fixed in the real world. Ranges make the uncertainty visible, which is usually more defensible for finance, leadership, or agency review than a single-point forecast.
What Data Should Be Included in a DOOH Performance Report?
At minimum, include the date range, market scope, audience definition, assumptions, and a clean split between observed outcomes and modeled estimates. If that information is missing, the report may still be useful for discussion, but it is harder to defend as an approval-ready performance summary.