

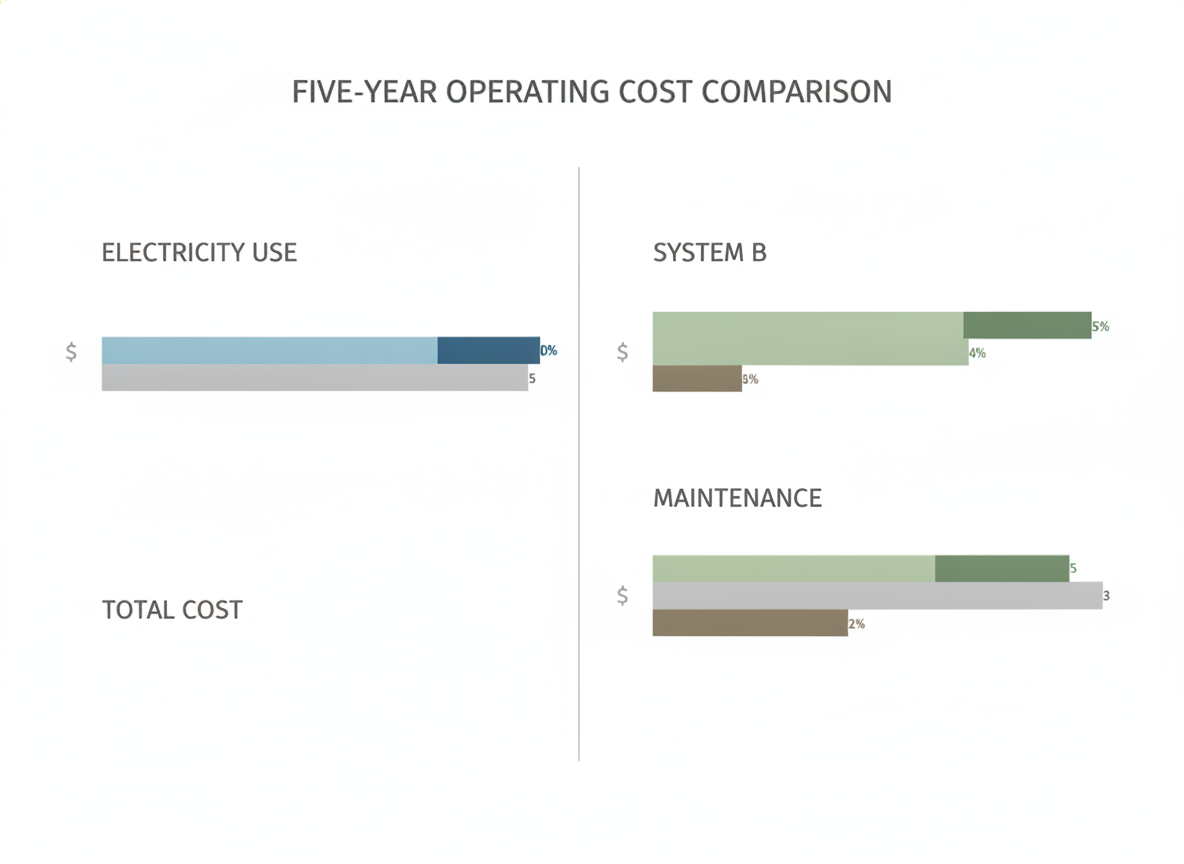
LED wall power efficiency matters because electricity is an operating expense that compounds every hour a 24/7 wall is on. For finance and facilities teams, the real question is not just what the display costs to buy, but what it may cost to run for five years, especially when utility rates, runtime, and brightness assumptions all move the total. 24/7 mission-critical walls are only worth comparing this way when you first normalize the operating basis.
Why Power Efficiency Matters in 24/7 LED Walls
A 24/7 command room wall can look affordable on the quote and still become expensive in operation if the power model is fuzzy. That is why LED wall power efficiency belongs in the approval discussion early, before anyone locks in cabinet size, brightness targets, or vendor assumptions.
Electricity cost is different from purchase price. Purchase price is a one-time capital expense. Electricity, by contrast, becomes a recurring operating cost that can keep climbing as long as the wall stays on. In U.S. commercial settings, the baseline rate is only a starting point because local rates vary materially by region, so a five-year model should always use the site’s actual utility rate rather than a national average alone. See the current U.S. commercial electricity rate baseline for a grounding point.
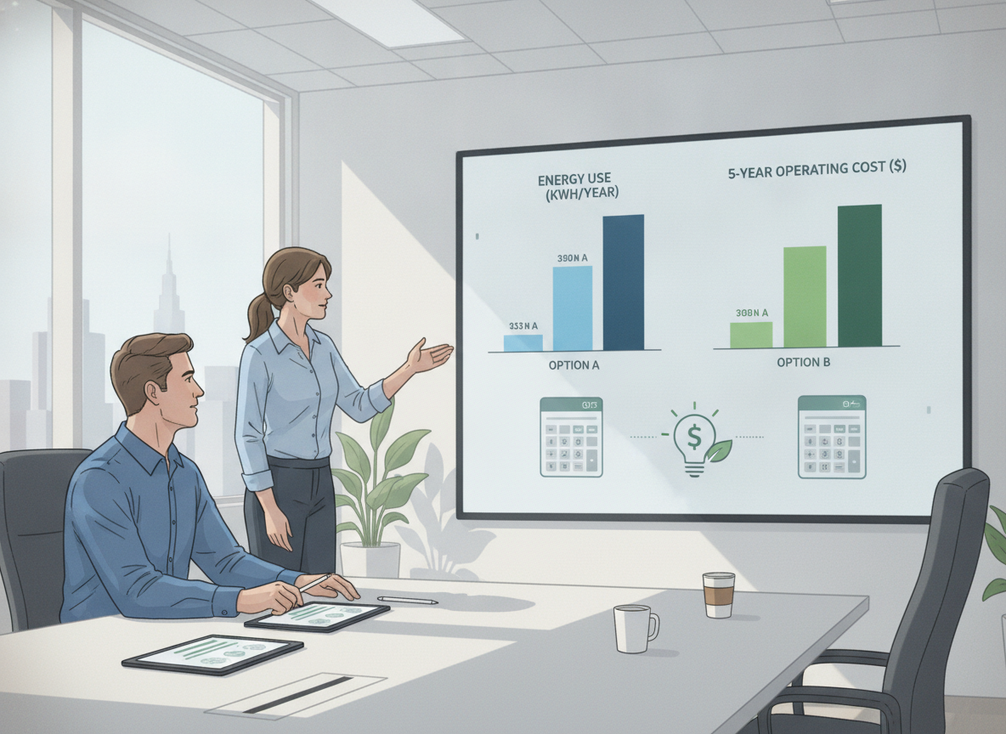
That framing also helps keep the discussion honest. A display that looks slightly more expensive up front may still be easier to justify if its operating profile is lower, but that depends on the real duty cycle, not a marketing claim. If the wall is truly mission-critical, the right comparison is the one that shows total running cost clearly enough for finance, facilities, and procurement to sign off on the same assumptions.
How to Model Five-Year Electricity Cost
Start with average power, not peak power. Peak power helps with circuit sizing, but average power is what drives the electricity bill. Then combine that with runtime and your utility rate. That is the cleanest way to turn LED wall power efficiency into a five-year cost estimate.
- Collect the average wattage the wall is expected to use in its actual operating mode, not the highest number in a brochure.
- Convert watts to kilowatts by dividing by 1,000.
- Multiply by daily runtime to get kilowatt-hours per day.
- Scale to annual use by multiplying by 365, or by your actual operating days.
- Multiply by the local commercial rate to get annual electricity cost.
- Multiply by five for a simple five-year estimate.
In plain language, the formula is: average watts ÷ 1,000 × hours per day × days per year × utility rate × 5. A U.S. rate source is helpful because it keeps the estimate grounded in current commercial pricing, but the real budget number should still reflect your location and operating schedule. The U.S. commercial electricity rate baseline is the right place to start.
For budget review, do not treat the result as fixed. A wall that runs overnight, runs at higher brightness, or sits in a room with stricter cooling requirements can move the total quickly. If you are comparing proposals, ask each vendor to use the same runtime, the same wattage basis, and the same utility rate assumption so the math stays apples-to-apples.
Common-Cathode and Power-Supply Choices
Common-cathode LED power consumption can be lower than traditional common-anode approaches in some operating conditions, but that is a directional benefit, not a universal savings promise. The difference depends on the implementation, the brightness profile, and whether the system is actually tuned for the workload you plan to run. A technical reference on common-cathode displays describes lower energy use as a possible outcome of matching voltage delivery to the LEDs more precisely; see the common-cathode power use discussion for background.
| Decision input | Reader-safe value / range | How it affects five-year electricity cost | Boundary or caveat |
|---|---|---|---|
| Common-cathode architecture | Can reduce power use in some setups | May lower operating cost if the wall runs long hours | Not a fixed savings percentage for every installation |
| Power-supply design | Must be compared on measured consumption, not labels | Better delivery and tuning can improve efficiency | Architecture and implementation are not the same thing |
| Brightness profile | Often changes with control-room usage | Higher brightness usually raises power demand | Marketing brightness is not the same as real operating mode |
| Duty cycle | 24/7 or near-24/7 use compounds small differences | Longer runtime magnifies any wattage gap | Short-use rooms will not see the same cost effect |
The practical takeaway is simple: compare measured power under the same conditions. If one proposal quotes peak power and another quotes average power, the lower number may just be the less honest one. For a control room, common-cathode is most interesting when the wall runs long hours and the vendor can show the operating basis clearly. If not, it is better treated as a possible efficiency advantage than as a budget guarantee.
What Drives the Biggest Cost Differences
The biggest electricity-cost levers are usually runtime, brightness, and the room’s operating conditions. In other words, the system that stays on longer and runs brighter will usually cost more to operate, even if the hardware is similar on paper.
Runtime and Duty Cycle
A 24/7 wall compounds small wattage differences into real annual spend. That is why duty cycle should be documented before you compare proposals. If the wall is scheduled down at night, or dimmed during low-activity hours, the five-year cost model changes materially. If your use case is truly continuous, then even modest efficiency improvements can matter more over time.
Brightness and Content Mix
Brightness settings are one of the easiest assumptions to miss. A control room that runs static dashboards at moderate brightness may have a different power profile than one that pushes vivid motion content all day. The reader-safe rule is straightforward: compare real use cases, not only the stated maximum brightness.
Pixel Pitch and Viewing Distance
Fine pitch affects the display choice, but it should not be treated as a power-efficiency shortcut by itself. Pixel pitch is about viewing distance, detail, and cabinet density first. If you are moving to a smaller pitch, verify the operating profile and the full system design instead of assuming the tighter pitch automatically lowers power use.
Room Conditions and Cooling Load
Lower display heat can matter for the broader facility energy picture, but it should stay separate from the wall’s direct electricity model. A reference on common-cathode and common-anode systems notes that reducing operating temperature can extend component life, which is useful context for long-term reliability. See the lower heat and service life discussion for a cautious overview. The facility cooling effect itself, however, is site-specific and should be modeled by the building team, not assumed from the display spec.
How Finance and Facilities Should Compare Options
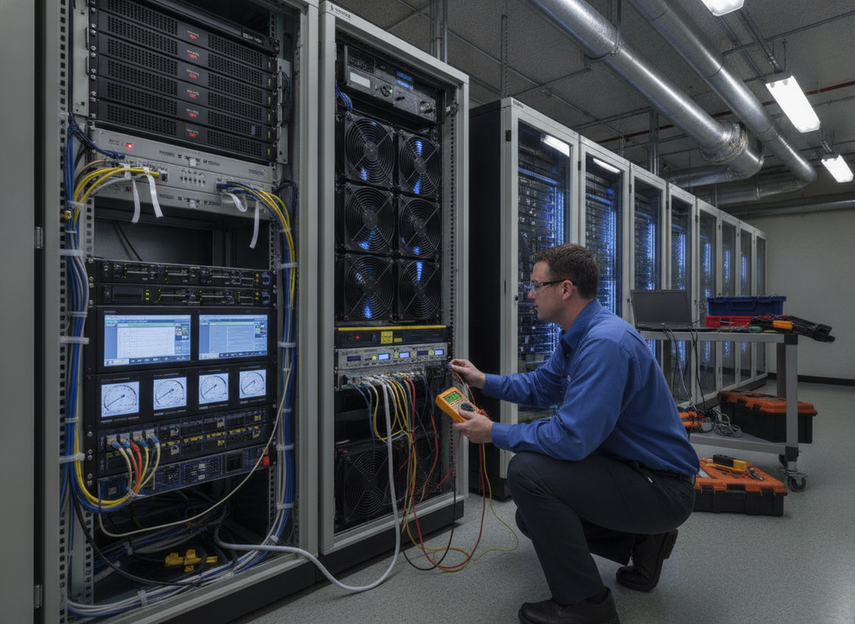
The cleanest way to compare proposals is to force the same inputs across every quote. Without that, one wall can look cheaper only because the vendor used a different wattage basis, runtime assumption, or brightness condition.
Use this checklist before you approve a five-year model:
- Ask for average wattage at the stated brightness basis, not just peak power.
- Confirm the daily runtime and whether the wall is dimmed or turned down at certain hours.
- Use the same utility rate for every proposal, then rerun the math with your local rate.
- Check the continuous-load circuit planning assumptions for 24/7 operation, because continuous loads must be derated under NEC guidance; the continuous-load circuit planning reference is a useful check.
- Separate display electricity from facility cooling so you do not double-count or blur the result.
- Treat missing power data as a budget risk, not a minor omission.
If the wall is part of a mission-critical room, the lowest modeled electricity cost is not always the best choice. Uptime, service access, and maintenance risk still matter. In practice, the best proposal is the one that fits the operating schedule, can be supported by the building electrical plan, and still gives finance a defensible five-year number.
Five-Year Cost Model Checklist
Before signoff, lock the assumptions in writing:
- Average wattage at the chosen brightness basis
- Daily runtime and any overnight dimming schedule
- Local commercial electricity rate
- Expected operating days per year
- Circuit-planning assumptions for continuous load
- Any room cooling assumptions that are being modeled separately
- The exact comparison basis used across all proposals
If the team wants to review product families after the model is set, start with mission-critical LED wall options or commercial indoor LED displays when you need a broader comparison. The key is to document the math first, then check which platform best matches the operating profile.
Final Takeaway
The best LED wall power efficiency decision is the one that turns watts into a five-year number your finance and facilities teams can defend. Start with average power, runtime, and the local utility rate, then separate display electricity from room cooling and compare proposals on the same basis. If you are reviewing mission-critical options, document the assumptions first, then use the operating profile to narrow the field instead of chasing the biggest headline savings claim.
FAQs
How Do You Estimate Five-Year Electricity Cost for an LED Wall?
Use average wattage, not peak power, then multiply by runtime, days per year, and your local commercial rate. That gives you an annual electricity estimate, which you can extend to five years. The most important check is whether every proposal uses the same assumptions, because inconsistent inputs make the comparison unreliable.
What Is the Difference Between Common-Cathode Design and Other Power Approaches?
Common-cathode design can reduce power consumption in some operating conditions, but the result depends on the actual implementation and the display’s workload. Treat it as a potential efficiency advantage, not a guaranteed savings number. It matters most when the wall runs for long hours and the vendor can show measured operating data.
Can Brightness Settings Change the Electricity Budget Enough to Matter?
Yes. Brightness is one of the easiest variables to overlook, and it can change the operating profile enough to move the budget. That is why the model should use the brightness setting you expect to run, not just the highest spec in the brochure.
Why Should a 24/7 Control Room Budget Include Cooling and Room Conditions?
Because the display’s heat output can affect the broader facility load, even if the LED wall electricity model is kept separate. The building team may need to account for ventilation or cooling changes, but those effects are site-specific. Do not assume the same HVAC outcome for every room.
What Should Vendors Provide to Compare LED Wall Power Efficiency Fairly?
Ask for average wattage at a stated brightness basis, the runtime assumption, and the conditions used to measure consumption. If a vendor only gives peak power or marketing language, the proposal is not ready for a five-year cost comparison. Comparable inputs are what make the budget defensible.