

LED video wall total cost of ownership, or LED wall TCO, is the right way to judge a command-room wall because purchase price alone hides power, labor, parts, and outage exposure. For enterprise and government buyers, the useful question is not just what the wall costs to install, but what it costs to keep available for five years and what happens when it is down.
What Drives LED Video Wall TCO
TCO for a video wall should include the full ownership stack, not just the quote on the hardware line. The U.S. Department of Energy’s federal TCO guidance ties ownership cost to energy utilization, workforce utilization, and maintenance throughput, which fits display projects where the budget has to survive real operations.
Build the Ownership Cost Stack
Start with these buckets: upfront hardware, installation and commissioning, power, maintenance labor, spare parts, service coverage, and downtime exposure. Keep every bucket on the same time horizon, such as five years, so one proposal does not look cheaper simply because it leaves out service or outage risk.
A lower purchase price can still produce a higher LED wall TCO if the system draws more power, needs more labor, or depends on slow service access. That is why the first comparison should be a cost stack, not a product list.
Match TCO to the Operating Environment
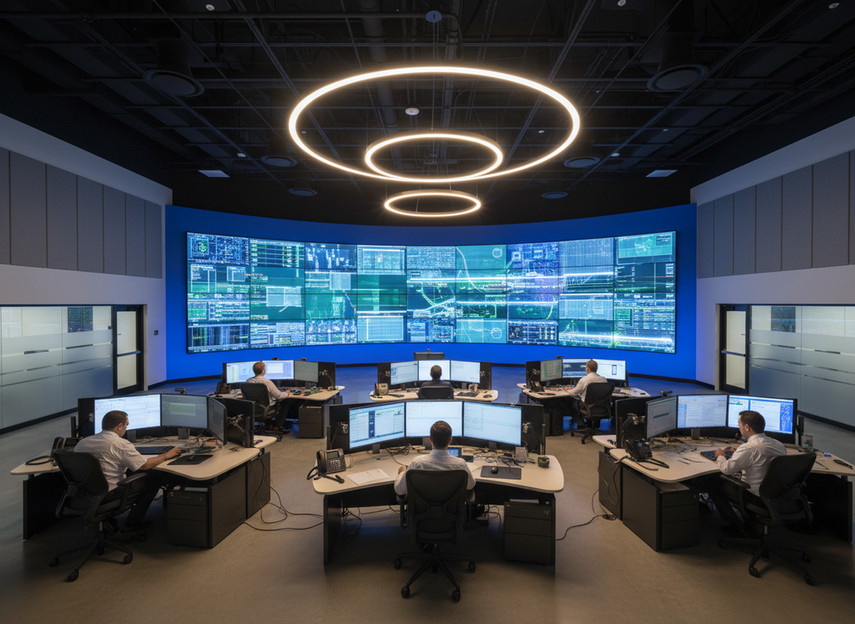
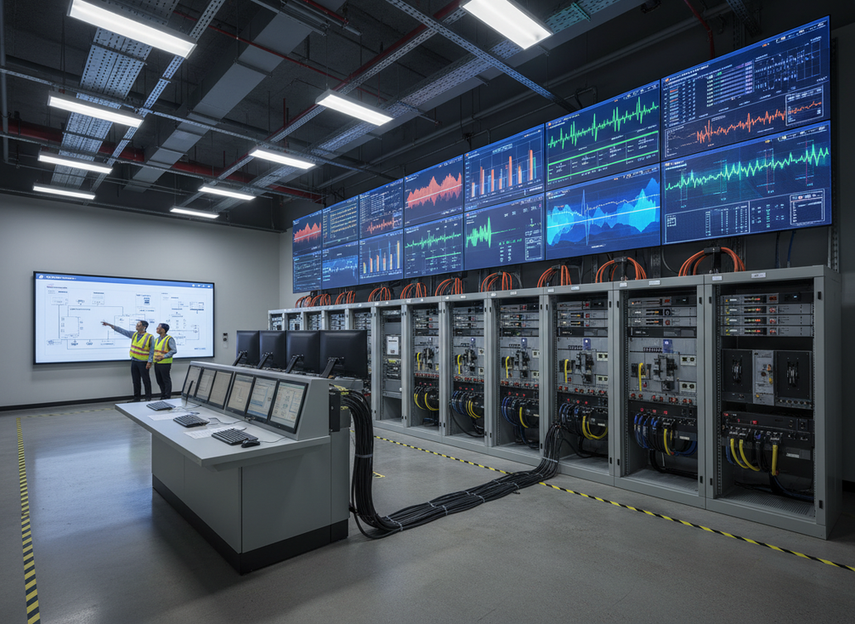
A 24/7 command center is not the same as a lobby wall or part-time meeting room display. The ENERGY STAR signage-display criteria show how display energy use depends on screen area and operating mode, and they distinguish signage displays intended for non-desk environments from consumer-use cases. In practice, more hours of use and tighter uptime expectations make maintenance and downtime matter more than they do in lower-duty installs.
For mission-critical environments, downtime is not a rare edge case. It is a budget line with operational consequences, especially when operators rely on the wall for shared situational awareness.
Separate Purchase Price From Ownership Cost
Procurement teams get better comparisons when they hold screen size, duty cycle, and operating hours constant and then compare the five-year ownership cost instead of the opening bid. That keeps the model fair and makes it easier for finance, IT, and operations to review the same assumptions.
If two proposals look similar on hardware, but one shifts risk into service delays or higher utility use, the cheaper quote may still be the more expensive wall over time.
Power Cost Is Only Part of Operating Expense
Electricity cost is usually the easiest line to estimate, but it is also easy to distort if the wrong operating mode or brightness assumption gets used. ENERGY STAR’s display specification calculates signage-display energy based on screen area, maximum luminance, and operating mode, which gives buyers a clean method for annual power-cost modeling. The practical takeaway is simple: power cost should be built from measurable inputs, not guessed from the sticker on the box.
Estimate Annual Electricity Use
Use a basic method: screen power draw in watts × hours per day × 365, then convert to kilowatt-hours and multiply by the local utility rate. The key is to model the wall in the mode it will actually run in, not at a theoretical maximum that never appears in daily use.
A buyer can get the inputs from vendor specs, facility utility bills, and the actual duty cycle planned for the room. If the wall runs 24/7, the annual spend will scale very differently than it would in a part-time conference space.
Identify the Inputs That Change Power Spend
Brightness setting is usually the first swing factor, because a brighter wall draws more power. After that come operating hours, content mix, and the efficiency of the selected display platform. If the room runs all day and night, the energy line compounds quickly, even when the per-hour difference seems small.
The ENERGY STAR video wall savings example is a useful direction check, not a universal promise. EPA’s estimated savings for signage displays and video walls show that a 3×3 video wall can save nearly $230 over its lifetime under the source’s assumptions, but that figure should stay configuration-specific. It is best treated as a benchmark for method, not a blanket savings claim.
Reduce Power Cost Without Skewing the Model
Use the brightness level that actually supports the room’s reading distance and ambient light, then document that assumption in the budget file. That keeps the model honest and avoids overbuying power capacity you will not use.
If the wall will spend most of its life below peak brightness, model the average operating state, not the maximum one. That produces a more defensible five-year LED wall TCO estimate.
Maintenance Labor and Spare Parts Add Up Fast
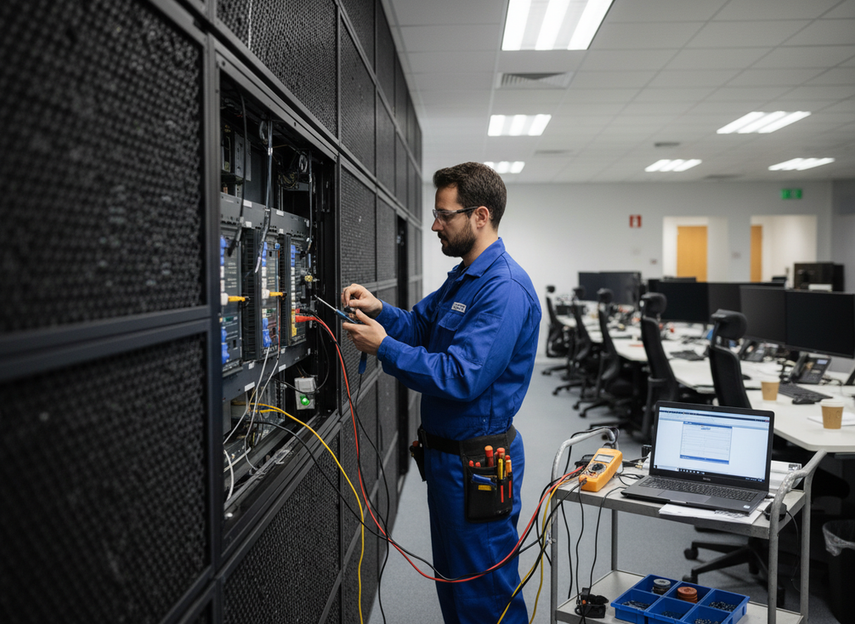
Maintenance cost is often underestimated because it gets collapsed into one vague annual allowance. A stronger model splits routine labor, corrective labor, spare parts, and service logistics. That approach fits the GSA maintenance framing, which treats maintenance as inspection, cleaning, regulation, and routine replacement work, not just emergency repair.
Model Routine and Corrective Labor
Include inspection, cleaning, configuration checks, and fault response as separate labor inputs. For budgeting, it helps to express labor as hours multiplied by rate, rather than as a single flat fee. Public service-rate references also show that specialized display support can be billed at daily rates plus travel and expenses, which is a useful benchmark for planning even if the exact contract terms will differ.
A publicly available SEC filing for specialized display support cites a daily support rate with travel and expenses, which is enough to show the structure of the cost, not to set a universal market price. That is the right way to use service benchmarks in procurement: as a comparison input, not a price guarantee.
Price Spare Parts and Service Stock
Spare parts affect both direct expense and repair speed. If the vendor stocks critical parts on-site or in-region, the repair path is usually shorter than if every part must be ordered after a fault appears. Mission-critical procurement documents also often call for extended warranty coverage and spare-parts stocking because those terms reduce long-run risk.
If a wall will live in a 24/7 control room, check the warranty period, the response window, and the parts stocking policy before comparing the sticker price.
Use Service Access to Contain Labor
Access design matters because easier service paths can shorten repair windows. Front-serviceable or otherwise accessible designs can lower labor time and reduce the odds that a small fault becomes a long outage. An NSCA case study on a large university installation notes that front-serviceable design can significantly speed repair and reduce downtime risk in mission-critical settings.
That does not mean front service eliminates maintenance cost. It means access design is part of the cost model, so buyers should compare service assumptions the same way they compare cabinet size or pixel pitch.
Downtime Cost Needs a Separate Line Item
Downtime should be modeled separately from repair cost because the business impact is different from the labor bill. A failed display in a command center can delay decisions, interrupt workflows, and create overtime or coordination cost while the wall is unavailable. The real number is site-specific, so the safest method is a scenario model rather than one universal dollar figure.
Quantify Operational Impact
Start by naming the workflow that depends on the wall. If operators lose shared awareness, the cost is not only the repair labor; it is also the time the team spends working with a degraded view. That impact can be minor in a lounge display and major in a government operations room.
If the room cannot tolerate even a short display outage, downtime belongs in the budget model before any final vendor ranking.
Link Repair Time to Cost
Repair time is the bridge between hardware design and financial exposure. On-site spares, local support, and easier service access can shorten the outage window, while remote service, awkward access, or long part lead times can lengthen it. For that reason, service terms matter as much as panel specs when the wall supports continuous operations.
A practical way to keep the model conservative is to use a low, mid, and high scenario tied to repair time and operational dependency. Low might assume a simple fault with quick access. Mid can assume a part replacement that requires normal service coordination. High should capture a longer outage path with slower response or harder access.
Use Scenarios Instead of False Precision
Do not assign one clean downtime number unless the site already has loss data. For most command-room projects, the better practice is to show scenario bands and document the assumption that drives each band. That gives procurement and leadership a clear risk picture without pretending the loss is exact.
When the wall is mission-critical and the room has no easy fallback display, the conservative downtime scenario should be the one that drives approval.
Five-Year TCO Comparison for Procurement
A five-year view works best when every proposal is normalized to the same screen size, same duty cycle, and same operating hours. The table below shows the cost inputs procurement should compare side by side before budget approval.
| Cost category | What to verify | Five-year impact | Who supplies the input | Verification note |
|---|---|---|---|---|
| Upfront hardware | Screen size, pixel pitch, cabinet type, controller package | Sets the opening spend | Vendor quote | Keep size and configuration constant across bids |
| Installation and commissioning | Mounting, cabling, calibration, integration | Can be material in retrofit projects | AV integrator or vendor | Separate labor from hardware so the quote stays apples-to-apples |
| Power | Watts, brightness mode, daily run time, utility rate | Affects ongoing utility spend | Vendor specs and facility records | Model the actual operating mode, not maximum output |
| Maintenance labor | Routine checks, corrective repair hours, response window | Drives service spend | Vendor service terms | Use hours × rate instead of one vague allowance |
| Spare parts | On-site, regional, or ordered-on-failure policy | Changes both cost and outage risk | Vendor or procurement docs | Stocking policy matters more in 24/7 rooms |
| Service coverage | Warranty term, parts coverage, travel terms | Reduces surprise repair bills | Vendor terms | Compare exclusions and response commitments |
| Downtime risk | Repair access, redundancy, fallback workflow | Can outweigh small price differences | Operations and facilities | Use low, mid, and high scenarios, not a single exact figure |
This framework also works for a replacement project. In that case, add the cost of removing the old wall and any retrofit work needed for power, data, or mounting. A price-only replacement bid can look attractive until those site constraints are added.
Command center systems can be useful navigation for teams already shopping a mission-critical configuration, but the real buying decision still comes back to the five-year cost stack above.
Buyer Checklist Before Budget Approval
Before you approve an LED wall budget, verify the duty cycle, the assumed brightness level, the power draw, the service term, the spare-parts policy, and the repair access path. Ask vendors for the documentation behind those inputs so procurement, facilities, IT, and operations are all reviewing the same five-year model. If the room is mission-critical, make the downtime scenario part of the approval packet, not an afterthought.
If you are comparing proposals now, put the numbers into one five-year sheet and check which quote still wins after power, service, spare parts, and outage risk are included. That is the clearest way to approve an LED wall TCO budget.
FAQs
What Is the TCO of an LED Wall?
It is the full cost of owning and operating the wall over time, not just the purchase price. For budgeting, that means combining hardware, installation, power, maintenance, spare parts, service coverage, and downtime exposure into one five-year view.
How Do You Estimate LED Wall Maintenance Cost?
Break it into routine labor, corrective labor, parts, and logistics, then price labor by hours and rate. The key check is whether the proposal separates inspection, repair response, and parts stocking, because a single annual allowance usually hides the real cost drivers.
What Drives LED Wall Operating Cost?
Power, duty cycle, and service burden usually move the budget most. If the wall runs long hours or at higher brightness, utility cost rises; if service access is difficult or parts are not stocked, maintenance cost and outage exposure rise with it.
Can Downtime Be Modeled Before Installation?
Yes, as a scenario model. Use low, mid, and high cases based on repair time, redundancy, and how dependent the room is on the wall. If no fallback display exists, the high scenario should receive more weight in the approval review.
Why Does a Five-Year LED Wall TCO Model Matter in Procurement?
It makes proposals easier to compare on the same basis. A five-year model shows whether a lower quote actually stays cheaper after power, service, spare parts, and downtime are added, which is the comparison most budget approvers need.