

A realistic DOOH ROI model starts with one question: can the site still work after you subtract build costs, operating expenses, downtime, and measurement uncertainty? If the answer only looks good in a best-case sales deck, the site is not ready for approval. The sections below show how to judge revenue, costs, impression measurement, and payback before you commit.
What Drives DOOH Revenue
A DOOH site makes money from a mix of location quality, inventory availability, pricing power, and how well the site is sold. High traffic helps, but traffic alone does not make a screen profitable. A site with strong sightlines, good dwell time, and a context that advertisers value can outperform a busier site with weaker viewing conditions.
For revenue planning, it helps to separate gross potential from realized revenue. Gross potential is the maximum if every sellable slot clears at the expected rate. Realized revenue is what you actually collect after slower sales, launch ramp, campaign gaps, and any inventory that never fills.
Location Quality and Visibility
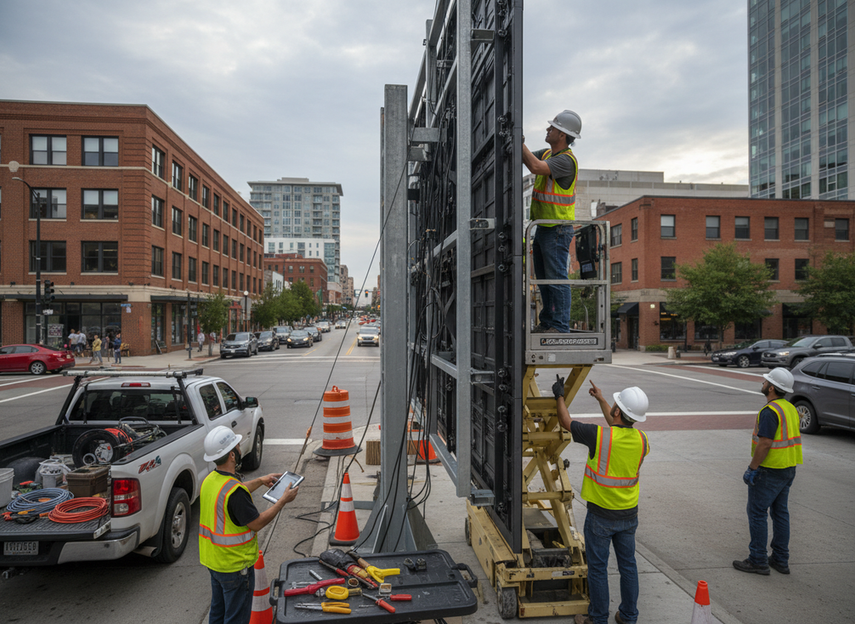
Roadside reach and clear sightlines matter more than screen size alone. If drivers or pedestrians have too little time to notice the screen, the site may still attract traffic but fail to attract demand. That is why a high-traffic corner can still produce a weak DOOH revenue model for property owners when visibility is poor or the use case does not fit the audience.
Inventory Mix and Occupancy
A site with more sellable dayparts, longer campaign windows, and consistent audience flow usually has a better chance of maintaining occupancy. The safer assumption is not “everything sells,” but “what sells first, what sells later, and what stays empty.” That matters because a digital billboard ROI calculation should be built on conservative fill rates, especially in the first months after launch.
Pricing Model and Sales Motion
Direct sales, network-style sales, and shared-revenue placements do not produce the same forecast. Direct sales can capture more upside if the local market can support it. Network sales may trade some yield for easier fill. Shared-revenue deals can reduce friction for the site owner, but they also change who carries the operating risk.
Measurement Inputs That Influence Revenue
Measurement credibility affects price. Buyers pay more confidently when the audience story is verifiable, not just inferred from raw traffic. The safest language for modern DOOH measurement is grounded in the MRC Out-of-Home Measurement Standards and Geopath’s visibility research methodology, both of which distinguish simple counts from more defensible audience measures.
| Scenario shift | Revenue impact | Cost impact | Payback impact | Measurement credibility |
|---|---|---|---|---|
| Higher fill | Usually strongest upside | Limited direct change | Can shorten payback if demand holds | No direct change |
| Higher CPM | Strong upside if sustained | Limited direct change | Can improve ROI materially | Depends on attribution quality |
| Higher operating cost or site rent | No upside | Strong downside | Usually lengthens payback | No direct change |
| Better verification | Indirectly supports pricing power | Small added cost possible | Can improve realized ROI if buyers trust reporting | Strong positive |
| Lower utilization | Revenue downside | Fixed costs remain | Most likely to worsen payback | No direct change |
The Cost Stack Behind Net Profit
Gross revenue is only the top line. Net profit depends on the full cost stack, including build cost, financing, installation, power, connectivity, maintenance, software, content updates, insurance, taxes, and sales overhead. If you only model the screen price, the site can look profitable on paper and fail in practice.
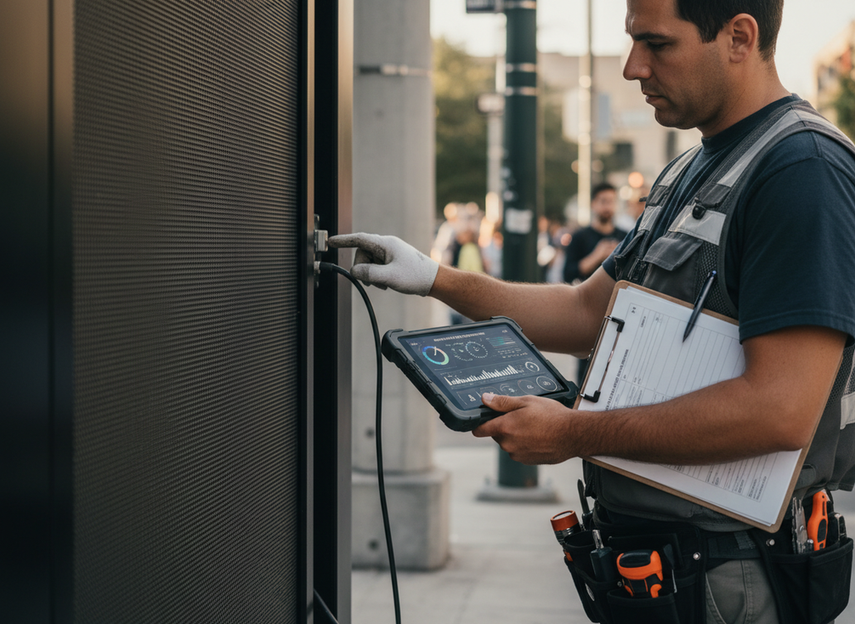
A clean way to think about it is to split one-time startup costs from recurring operating costs. Startup costs affect the payback period. Recurring costs affect whether the site keeps producing cash after launch. Both matter for outdoor LED advertising payback period estimates, especially when downtime or repairs reduce the number of billable days.
| Cost Category | Upfront Or Recurring | What It Changes In The Model | Cautious Forecast Assumption |
|---|---|---|---|
| Hardware and installation | Upfront | Initial capital requirement | Model as a real project cost, not just cabinet price |
| Financing | Recurring | Cash flow and payback speed | Include interest or capital cost if the project is financed |
| Power and connectivity | Recurring | Monthly operating margin | Use a steady monthly expense, not a best-case utility guess |
| Maintenance and repairs | Recurring | Availability and net profit | Reserve for outages, parts, and service calls |
| Software and content management | Recurring | Operations overhead | Include licensing, scheduling, and creative updates |
| Insurance and taxes | Recurring | Net return | Treat as part of the ownership burden, not optional overhead |
| Sales and account management | Recurring | Realized revenue | Count the cost of filling the screen, not just running it |
The biggest mistake is treating hardware price as the whole project. In a real DOOH revenue model for property owners, the owner structure matters. A landlord leasing space, a media company owning the network, and a partner on a rev-share deal will carry different costs and different risks.
How to Calculate DOOH ROI
Start with gross revenue, then subtract recurring operating costs to find operating profit, then compare that result to the capital you put in. If you skip the middle step, ROI becomes a marketing number instead of a decision tool.
- Estimate gross annual revenue from occupancy, rate, and available inventory.
- Subtract recurring operating costs such as power, repairs, software, insurance, and sales labor.
- Subtract financing costs if the project is debt-funded or structured with meaningful carrying cost.
- Compare the remaining cash flow with the startup cost to estimate payback.
- Run at least three cases: base case, downside case, and delayed-fill case.
That sequence matters because a single best-case estimate hides the two risks that usually change the answer most: slower fill and weaker rates. If the site only works when occupancy is nearly full from day one, the model is too fragile to approve.
A practical rule is to ask whether the project still looks reasonable if fill takes longer, campaigns are shorter, or pricing comes in below the original target. That is the difference between a digital billboard ROI calculation that supports a real budget and one that only supports a pitch.
What Realistic Payback Depends On
Payback gets faster when demand is steady, pricing holds, and downtime stays low. It slows down when bookings are uneven, rates soften, or the site spends too much time offline. The same physical screen can therefore have very different economics depending on contract structure and operating discipline.
Occupancy and Rate Stability
Steady occupancy usually matters more than one or two premium campaigns. A site with modest but consistent fill can beat a flashier site that sells a few expensive slots and then sits empty. That is why payback should be modeled as a range, not a single date.
Downtime, Maintenance, and Operations
Every hour the screen is offline reduces billable inventory. Delays in content approval, repairs, or network issues can quietly stretch the payback window. Operational discipline is not a separate technical issue; it is part of the financial model.
Ownership Structure and Revenue Share
A lease, a revenue-share deal, and full ownership split the upside differently. Revenue-share models can reduce the owner’s risk, but they also cap upside. Full ownership gives more control and more potential return, but it also exposes the buyer to the full cost stack and the fill-rate risk.
Downside Scenarios and Payback Risk
Before you approve a project, ask whether the economics still work in a weaker year. If the answer depends on perfect sales, ideal weather, and no downtime, the site is not a solid candidate yet. That is also where a realistic payback discussion matters more than headline promises, because even a strong site can miss its target if utilization slips.
How Impression Measurement Changes Pricing
Impression measurement is not a guarantee of revenue. It is a pricing input, and buyers will only trust it if the methodology is clear. That is why traffic counts, visibility-adjusted impressions, and proof of play should never be treated as interchangeable.
Traffic counts tell you how many people pass by. Visibility-adjusted approaches estimate whether those people actually had a chance to see the screen. Proof of play shows that ads ran as scheduled. Each one matters, but for different reasons.
The MRC OOH standards set a baseline for audience and play verification language, while Geopath’s measurement methodology explains why visibility research is more credible than raw counts alone. If a sales team cannot explain the method, buyers will usually discount the forecast.
The IAB’s DOOH measurement guide is useful background for omnichannel measurement and programmatic-style buying, but it does not replace primary audience standards. Use it to frame the market conversation, then keep the pricing logic tied to the method buyers can verify.
Measurement Inputs Buyers Expect
In a sales conversation, the usual inputs are traffic, exposure timing, delivery verification, and an audience story that matches the market. The forecast should use the same measurement logic that supports the price. If the model uses one method and the proposal uses another, trust drops fast.
Why Methodology Changes Valuation
Two screens with similar physical specs can be valued differently if one has stronger verified reach. That does not mean the better-measured screen magically creates more traffic. It means the pricing case is more believable, which can support better CPM logic and stronger renewals.
Proof of Play and Delivery Confidence
Proof of play helps confirm that the campaign actually ran. That is useful for billing and dispute reduction, but it does not replace audience measurement. In other words, proof of play helps verify delivery, while audience measurement helps justify pricing.
Common Measurement Mistakes to Avoid
Do not turn traffic counts into billable impressions without a visibility method. Do not assume ideal viewing conditions at every hour of the day. And do not double-count exposure just because a site sits in a dense corridor. Those shortcuts can inflate the model and damage buyer confidence later.
Can This Site Model Work for Your Location?
Use a final go/no-go check before you approve budget or sign terms. A site is worth pursuing when the location has credible visibility, the measurement method is defensible, the revenue model survives slower fill, and the cost stack still leaves room for profit.
A site is a better fit for ownership when you can control pricing, sales, and uptime. It is a better fit for partnership when you want lower risk and can accept less upside. It is usually a no-go when visibility is weak, occupancy assumptions are heroic, or downtime would quickly erase margin.
- Check whether the screen has clear sightlines and a buyer-relevant audience.
- Check whether the measurement method is disclosed before pricing.
- Check whether the forecast still works with slower fill and moderate rate pressure.
- Check whether downtime, repairs, and sales overhead are already in the model.
- Check whether the contract structure matches your risk tolerance.
If those checks fail, pause before ordering equipment or approving a lease. Compare revenue share vs. lease vs. ownership, verify the measurement method, and model base and downside cases first. That is the safest way to judge DOOH ROI without relying on best-case assumptions.
FAQs
How Do You Calculate DOOH ROI for a New Site?
Start with forecast revenue, subtract operating costs, then compare the remaining cash flow with startup cost and financing burden. The key check is whether the model still works when fill is slower than expected. If it only works on a perfect launch curve, it is too optimistic.
What Costs Should Be Included in a DOOH Profit Model?
Include hardware, installation, financing, power, connectivity, maintenance, software, insurance, taxes, and sales overhead. The useful test is whether the model would still make sense if repairs, downtime, or content changes cost more than expected. That is where many first-pass forecasts break down.
Why Do Impressions Affect DOOH Pricing?
Because buyers pay for expected audience value, not just screen presence. Impression estimates support pricing only when the method is transparent and credible. If the estimate comes from raw traffic alone, the price may look strong on paper but fail buyer scrutiny.
What Is a Realistic Outdoor LED Advertising Payback Period?
There is no universal timeline. Payback depends on capex, occupancy, rate stability, downtime, and contract structure. A better check is whether the site still looks acceptable in a delayed-fill case, because that is where optimistic timelines usually stretch.
Can a Property Owner Profit From Leasing DOOH Space Instead of Owning the Network?
Yes, but the economics are different. Leasing or revenue share can reduce risk and complexity, while ownership can increase upside and control. The right choice depends on whether you want passive income with lower control or a larger operating role with more upside.